Due date for the tasks are listed in the schedule
Follow the instructions in Submission via GitHub Pages to create a new repo in the existing organization. Solve the tasks in a file named index.qmd.
Download the datasets swissTLM3D and swissboundaries3d from swisstopo. Using swissTLM3d and swissboundaries3d, calculate the percentage of area covered by forest per canton. Visualize the results (in a map and / or a plot).
Render the document using quarto preview. Publish your result using quarto publish gh-pages
We have prepared a duckdb database on moodle (wald-kantone.duckdb). This database contains two layers: The forest data from swissTLM3D and the canton boundaries from swissBOUNDARIES3D.
Use this dataset and with the help of DuckDB in practice, recreate Task 1 and measure the execution time using the R package tictoc.
Compare the execution time with Task 1. Discuss!
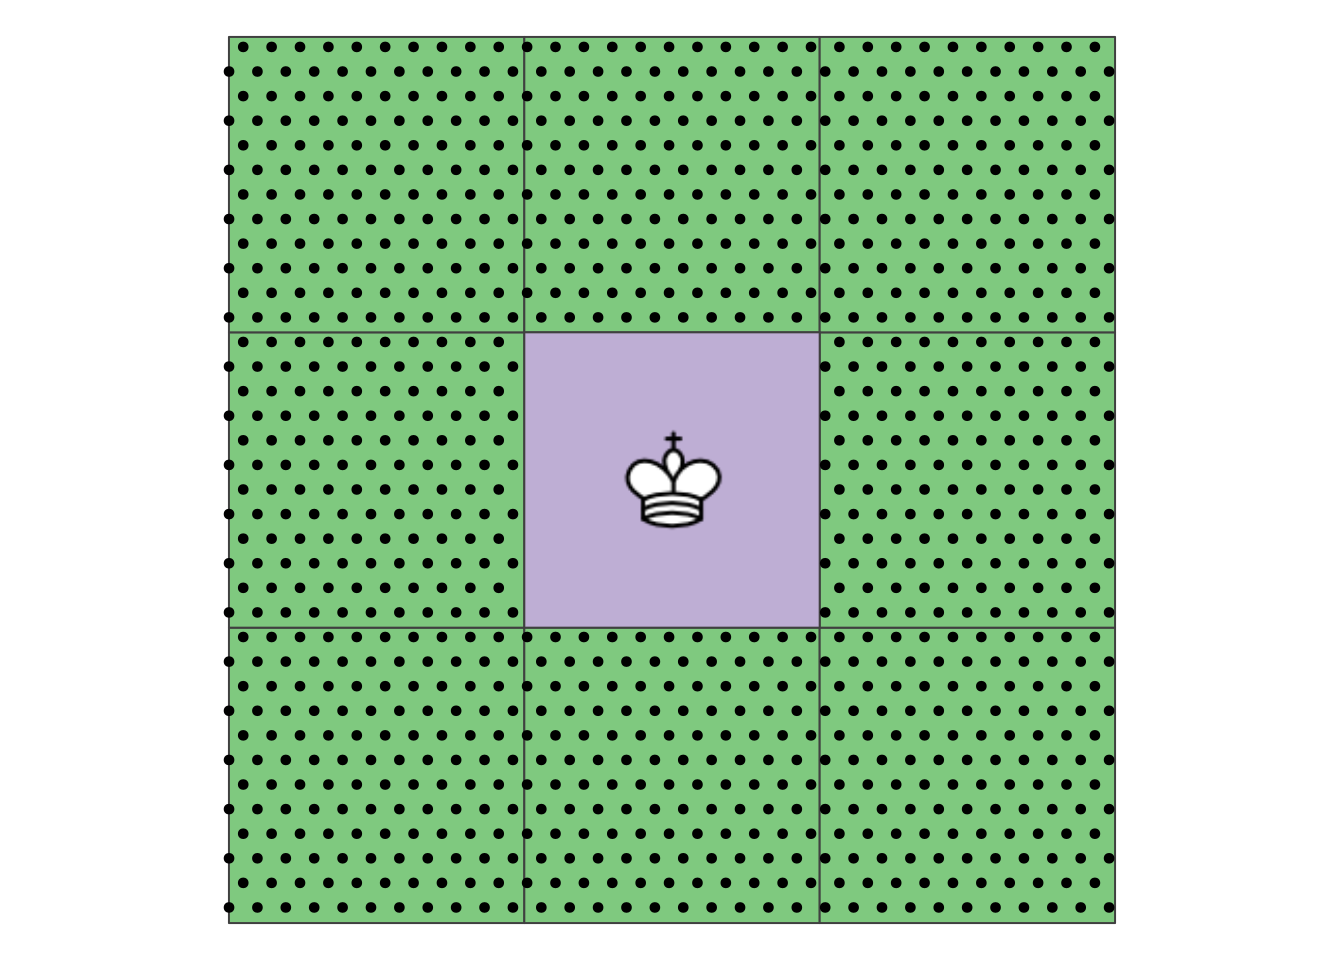
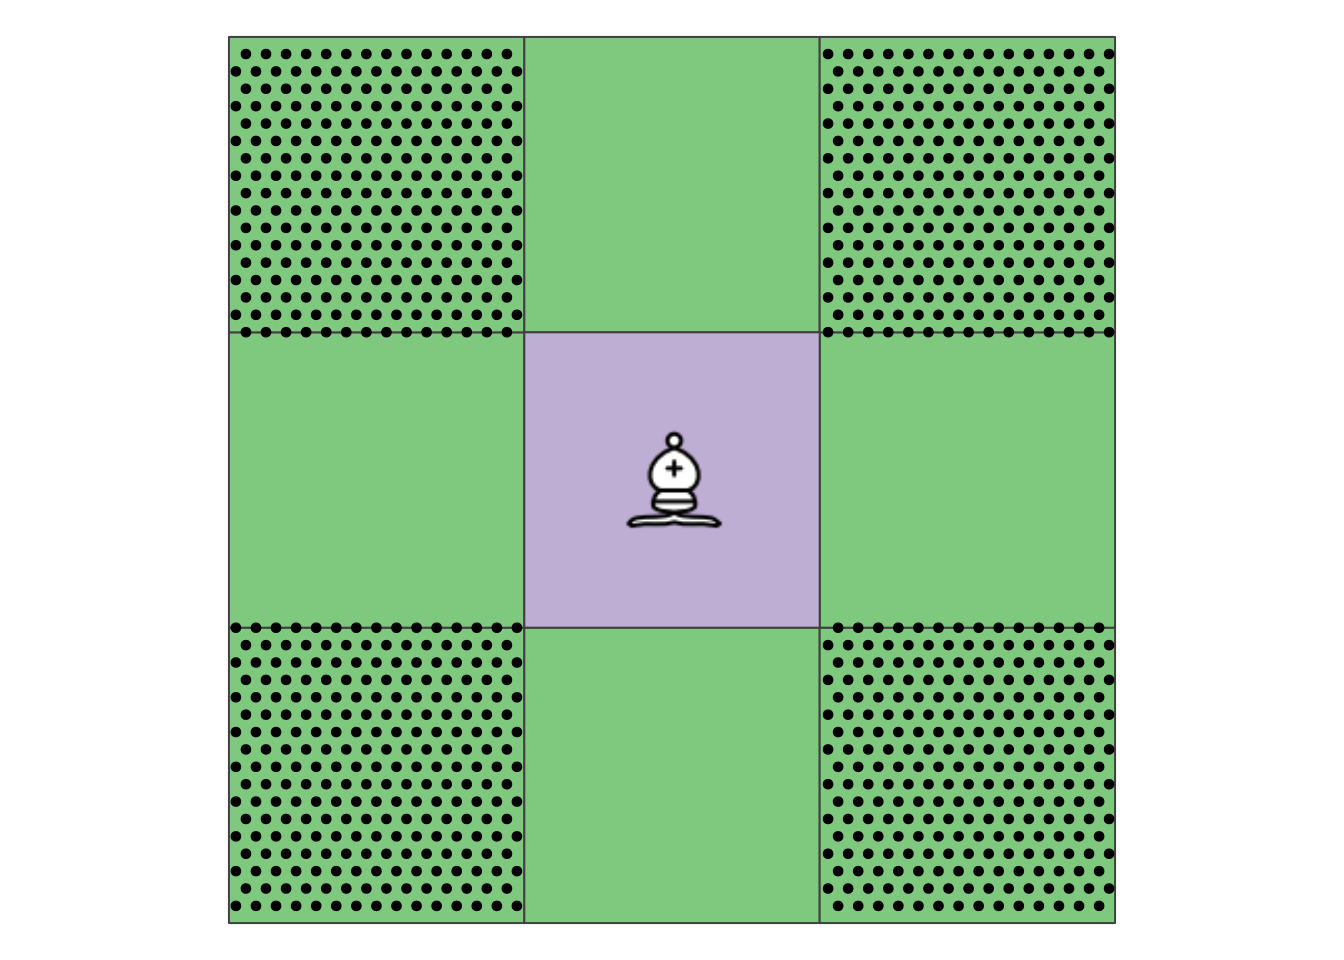
Without consulting external help, try and specify the DE-9IM string for the queen and bishop’s case as shown in Figure 1.
Concentrate on the boundary-boundary intersection. Note:
F01*The 3x3 “chessboard” is available on moodle.