🚀 Tasks
As always, the data for this task is on moodle. Follow the instructions in Submission via GitHub Pages to create a new repo in the existing organization.
In this task, you will analyze the cycle network of Switzerland using R. The dataset comes from the Federal Roads Office FEDRO (ASTRA).
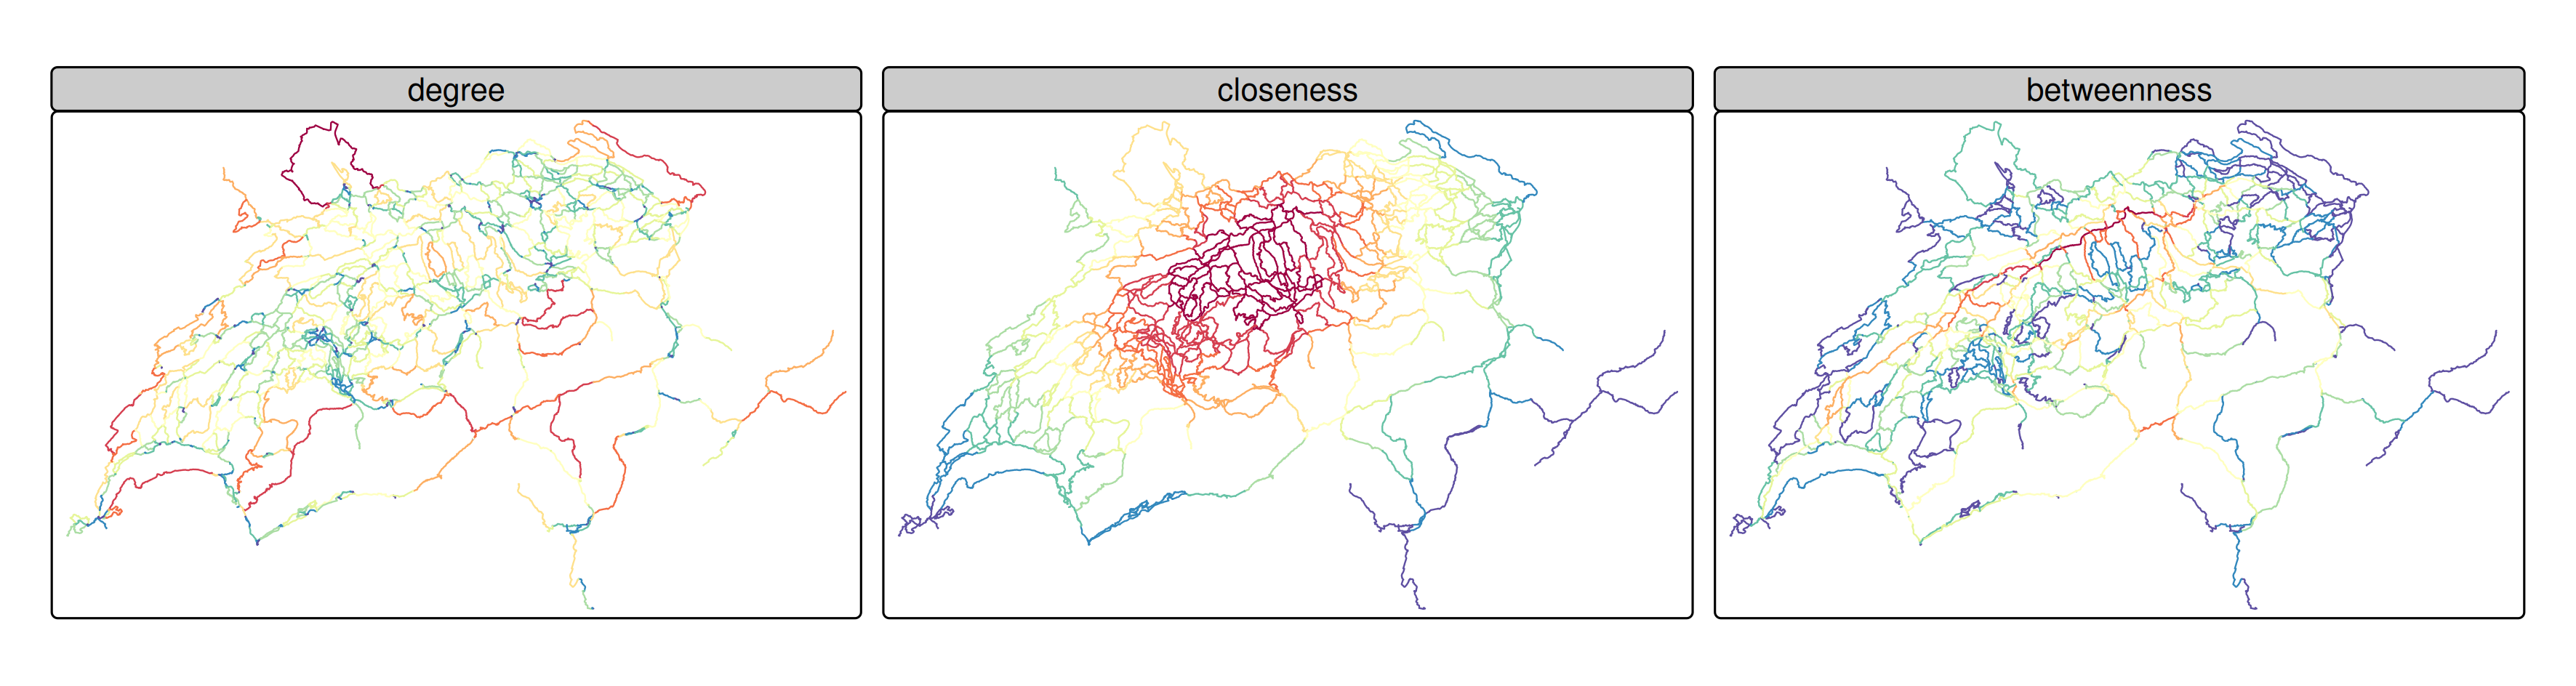
The goal is to compute different centrality measures (degree, betweenness and closeness) for the nodes in the network and visualize the results. To do this, follow the following steps:
Load the rail network data using
sfConvert the data into an undirected network using
sfnetworksTo calculate centrality, the edges need to have “weights”. Assuming equal cycling speed on all roads, you can use the edge length (from the column length) as the weight.
To compute the centrality measures you will need to
- activate the nodes (using
tidygraph::activate()) - Use
dplyr::mutateto create new columns and populate these with the centrality measures using the functionscentrality_betweenness,centrality_closenessandcentrality_degreefromtidygraphusing the column length as weights.
- activate the nodes (using
Convert the enriched network consisting of edges and nodes back to
sfobjects consisting of lines and points (usingactivateandst_as_sf)The centrality values are attached to the points. Transfer the values to the lines by using the following function, which takes the mean centrality values over all nodes for each edge
aggregate(veloland_nodes, veloland_edges, FUN = "mean")Visualize the result (for an example, see Figure 1). If necessary, transform or reasonably categorize the values to make them more comparable
Discuss the results: How do you interpret the differences?