As always, the data for this task is on moodle. Follow the instructions in Submission via GitHub Pages to create a new repo in the existing organization.
Task
Redo your task from last week, but extend your feature set by incorporating context information as described in the Getting started section below. Add at least 2–3 features of your own beyond the examples shown.
Compare your results to the ones you got last week. Does your model perform better when context information is added?
Getting started
Last week, we tried to predict travel mode using movement parameters only. This simple approach can potentially already lead to good results, however we’re missing out on information readily available: environmental data.
Context information such as road type, train lines, bus stops etc. can provide valuable additional information for predicting travel mode.
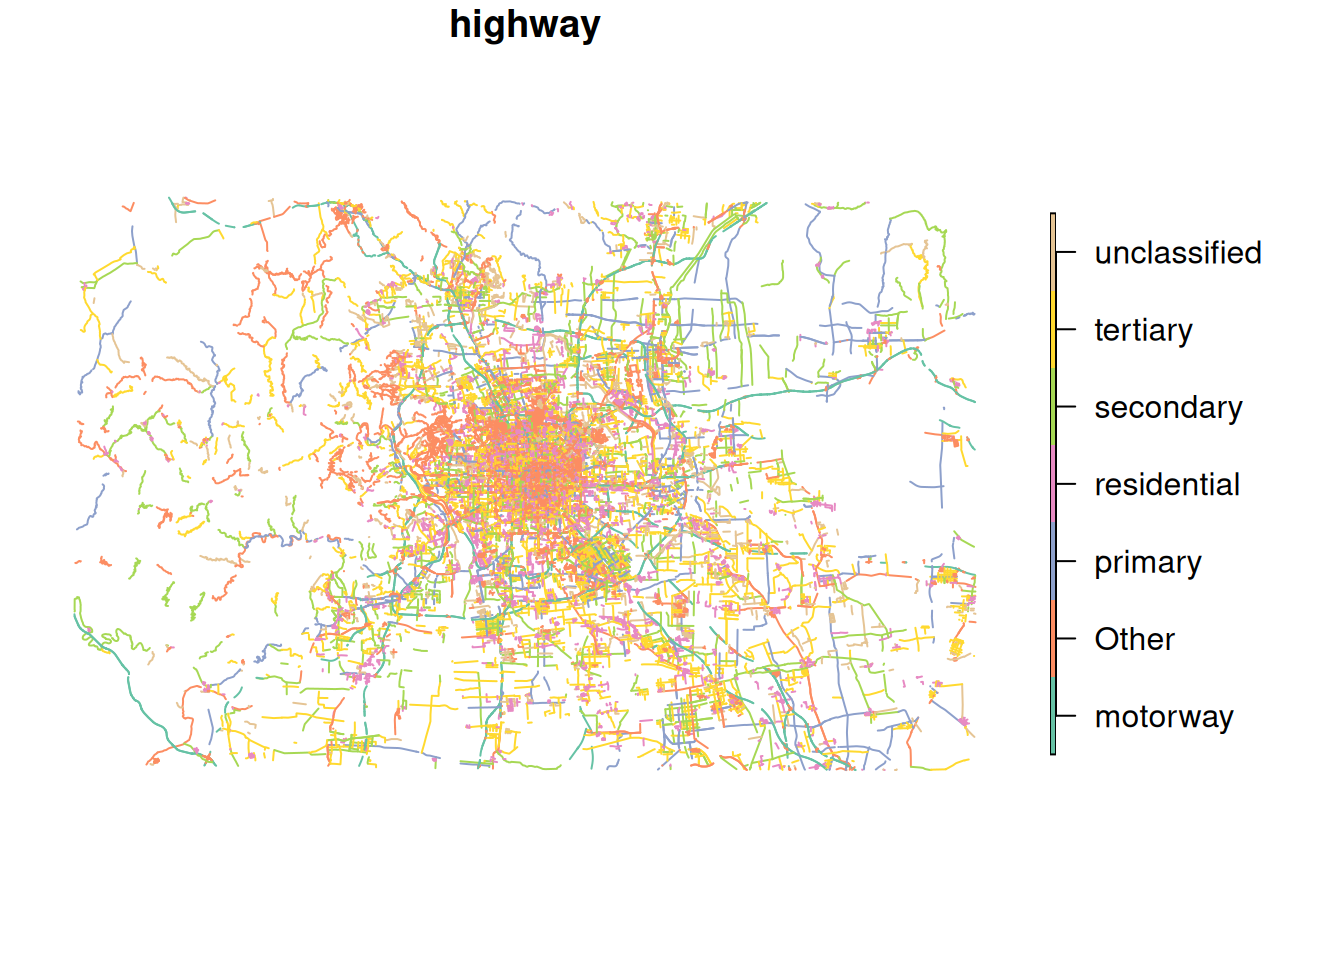
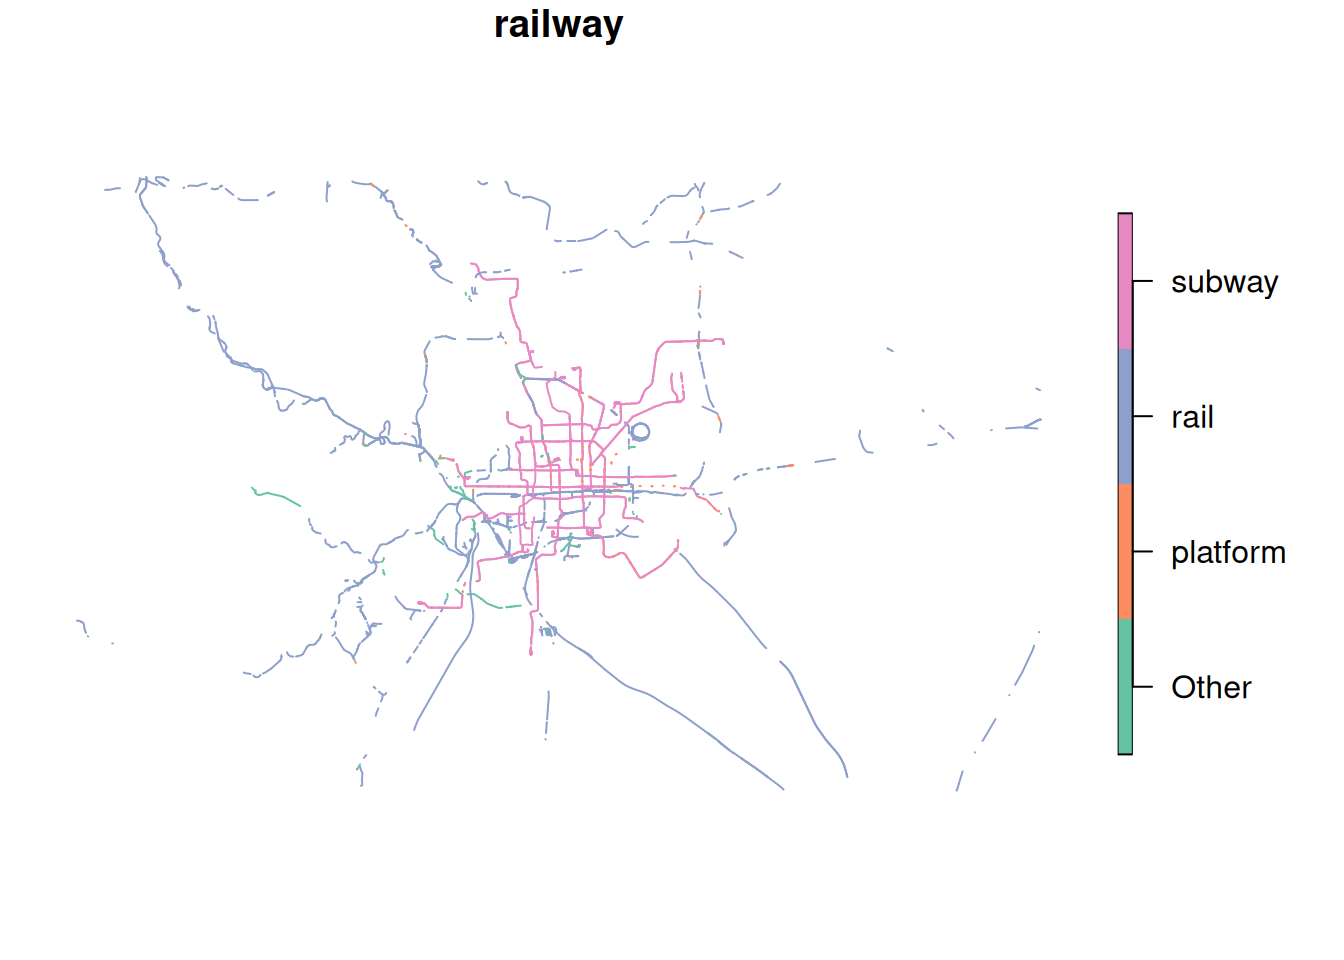
We prepared some data from OpenStreetMap, obtained from extract.bbbike.org/. The preparation included:
Extracting highways and railway lines from the archive.
Projecting the data to WGS 84 / UTM zone 50N (EPSG:32650).
For highways: adding the column cycleway which is TRUE if the road segment includes tags related to cycling infrastructure.
Lumping the multitude of categories (column highway and railway for the respective datasets) into the most frequent 6 and 3 categories, respectively.
Note
OSM uses the term highway to mean roads in general, not specifically main roads. The column highway differentiates different types of road. See the OSMWiki for more details.
To use this context information as additional features, we first need to import our movement data:
# For illustration purposes, we will only use 500 samplestraining_dataset <-read_sf("data/movement-I/tracks_1.gpkg", query ="SELECT * FROM training LIMIT 500") |>mutate(data ="training")
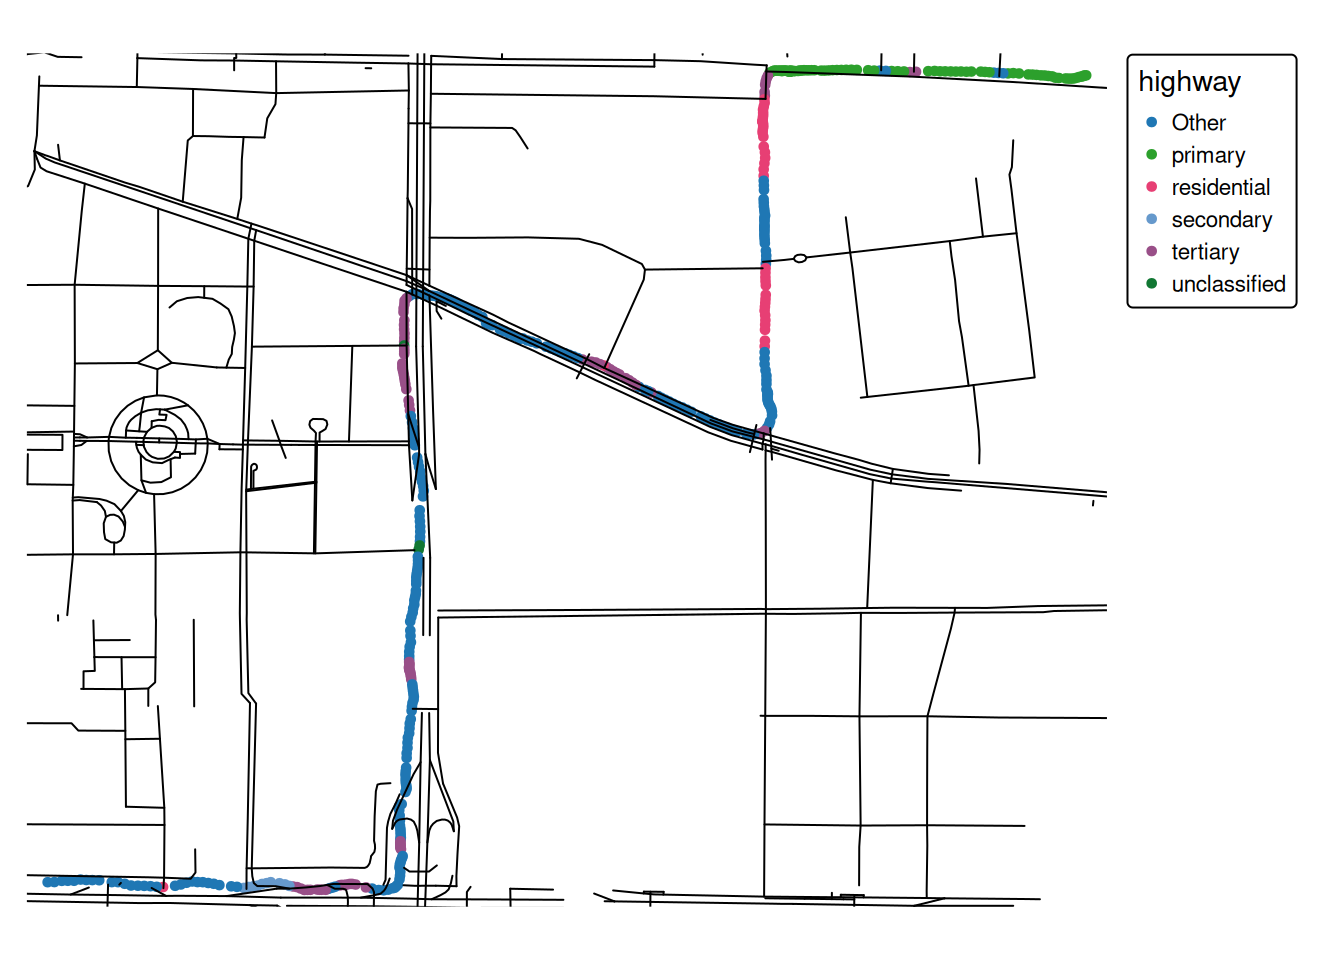
Now we can join the movement data with the context information using various methods. A simple approach is to use the attribute data from the nearest feature for each data point.
training_dataset_join <-st_join(training_dataset, highway, join = st_nearest_feature) |># Selecting these columns is for illustration purposesselect(user_id, datetime, highway, cycleway)training_dataset_join
Simple feature collection with 500 features and 4 fields
Geometry type: POINT
Dimension:     XY
Bounding box:  xmin: 452732.2 ymin: 4417605 xmax: 454778.1 ymax: 4419221
Projected CRS: WGS 84 / UTM zone 50N
# A tibble: 500 × 5
   user_id datetime            highway cycleway               geom
     <int> <dttm>              <chr>   <lgl>           <POINT [m]>
 1      10 2008-06-18 16:47:35 primary NA       (454778.1 4419210)
 2      10 2008-06-18 16:47:37 primary NA         (454775 4419210)
 3      10 2008-06-18 16:47:38 primary NA       (454772.7 4419209)
 4      10 2008-06-18 16:47:39 primary NA       (454769.7 4419208)
 5      10 2008-06-18 16:47:40 primary NA       (454765.2 4419207)
 6      10 2008-06-18 16:47:41 primary NA         (454760 4419205)
 7      10 2008-06-18 16:47:42 primary NA       (454754.7 4419204)
 8      10 2008-06-18 16:47:43 primary NA       (454749.4 4419203)
 9      10 2008-06-18 16:47:44 primary NA       (454743.9 4419204)
10      10 2008-06-18 16:47:45 primary NA       (454737.8 4419204)
# ℹ 490 more rows
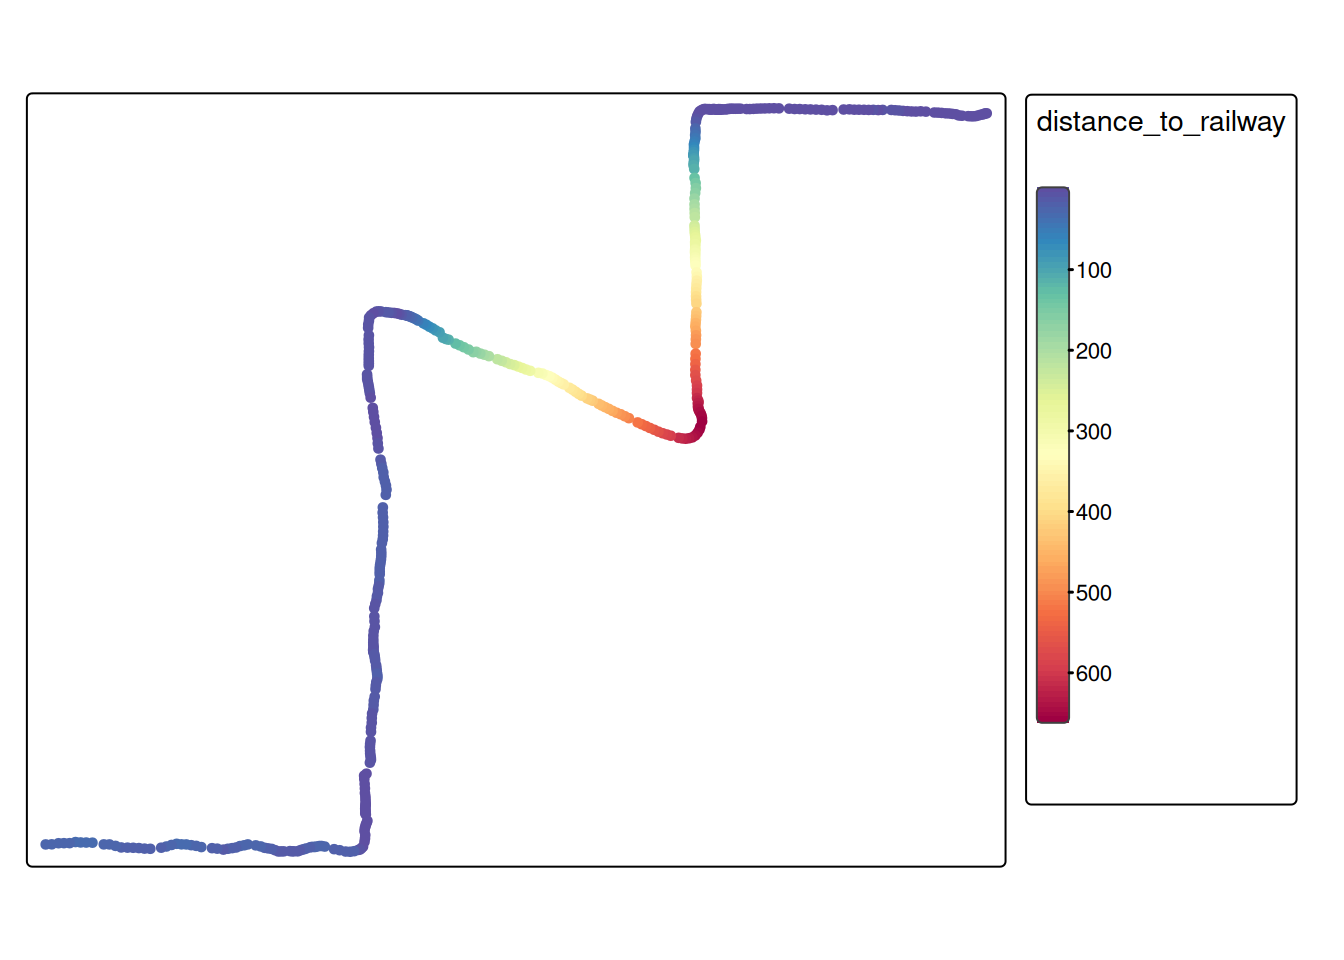
For some datasets, it might make sense to calculate the distance to the closest railway line. We’ll illustrate this using the railway data:
# First, determine the nearest railway for every movement samplenearest_railway <-st_nearest_feature(training_dataset_join, railway)# Now, we can calculate the distance to the nearest featurerailway_dist <-st_distance( training_dataset_join, railway[nearest_railway,],by_element =TRUE )# Add this as a feature to our training datatraining_dataset_join$distance_to_railway <-as.numeric(railway_dist)tm_shape(training_dataset_join) +tm_dots(fill ="distance_to_railway", fill.scale =tm_scale_continuous(values ="-brewer.spectral"))
Note
In the example above (distance to the nearest railway), it would probably make sense to use a threshold value to differentiate close to railway vs. far from railway. In this case, you could also use the function st_is_within_distance().